Safety & observability
ActiveEdge Telemetry Lakehouse
One governed data platform for edge AI device events, from raw arrival to operator answers, with every bad record quarantined for a reason. Runs end to end on synthetic replay.
Measured results
- Lines ingested13,994Six-hour synthetic replay, Oct 22, 2026
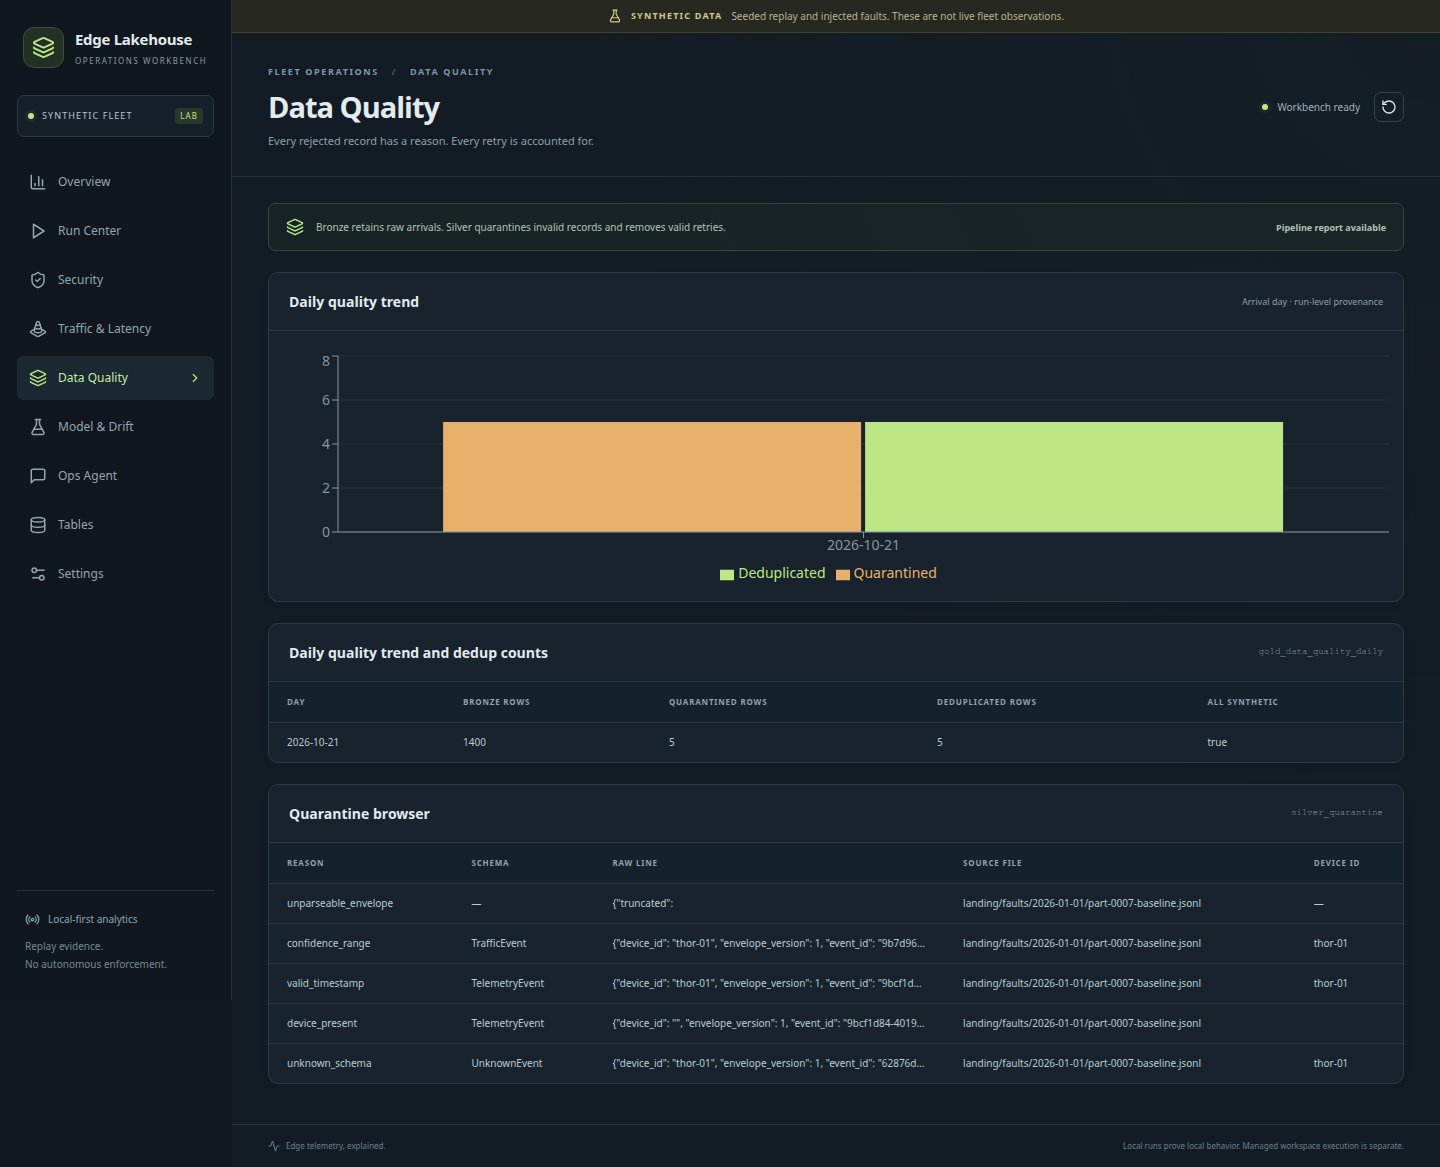
- Injected faults caught10 of 105 duplicates removed, 5 bad records quarantined
- Tests70 passingLocal Spark run, Oct 22, 2026
- Databricks workspace runNot yet runBundle written, not deployed
- PhysicalEdge device events
- Edge computeVersioned export envelope
- SimulationBronze, Silver, Gold tables
- SimulationAnomaly model and drift checks
- PhysicalOperator portal and read-only assistant
Hardware
Everything runs on one RTX 5090 workstation: PySpark 4.0 for the pipeline, DuckDB for read snapshots, and a FastAPI and React portal. The event shapes are modeled on what the lab’s Jetson AGX Thor and Orin projects emit: security sensor events, traffic events from street cameras, and per-frame inference latency.
Workload
A seeded replay generates six hours of fleet data across two edge nodes and two cameras, then injects known faults on purpose: retried uploads, a truncated line, an empty device id, a bad timestamp, an out-of-range confidence and an unknown schema. Because the faults are known, every one can be checked. No live fleet data is used.
What was measured
On Oct 22, 2026, seed 7, six hours:
- 13,994 raw lines landed in Bronze; 13,984 were valid.
- 5 of 5 injected duplicates were removed in Silver, using a content-based event id.
- 5 of 5 injected bad records were quarantined, each with a named rule.
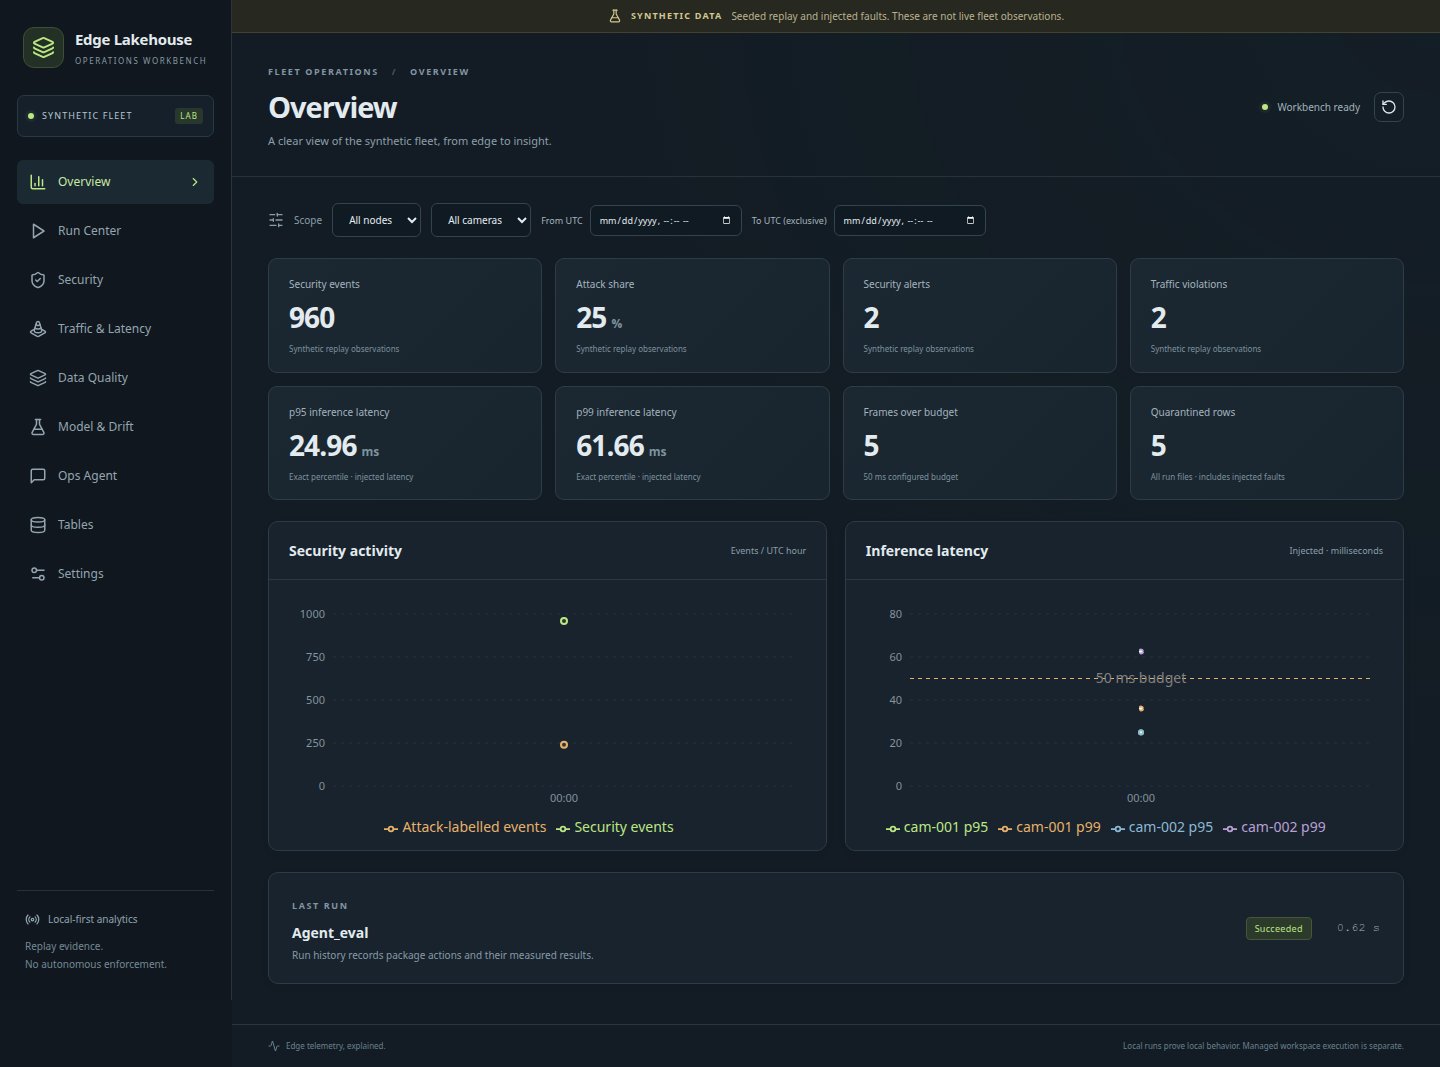
- Silver held 8,880 security events, 753 traffic events and 4,320 inference frames.
- Inference latency: p95 26.09 ms, p99 56.43 ms, with 57 frames over the 50 ms budget.
- With a drift scenario switched on (seed 8), 5 of 9 features were flagged as drifted.
What failed
- The anomaly model over-flags. It flagged 24 windows; 2 were real, so precision was 0.083. The 22 false alarms come from a contamination setting that assumes 3 percent of windows are anomalies.
- The assistant answered “which camera is slowest” with one fleet-wide number instead of a per-camera answer.
- For traffic questions, the assistant cited the port-scan runbook before the traffic runbook.
What changed
- Questions that ask “which”, “per” or “worst” now run grouped queries, so the assistant answers per camera or per device. cam-002 has the higher p99 at 57.98 ms; cam-001 is at 54.77 ms.
- Runbook search now ranks an exact match on the planned runbook first.
- The model threshold has not been changed yet. It is left as found.
Result
The pipeline runs end to end on synthetic replay, catches every injected fault, and the portal and read-only assistant answer from the Gold tables with citations. 70 tests pass locally.
What is not yet shown
It has not run in a Databricks workspace yet; the Asset Bundle is written but not deployed. It has not taken data from a live device. The model still produces too many false alarms. Those results will be published here when they exist.
Evidence
The charts behind the results